Linear Models
This lab script teaches the implementation and interpretation of the basic linear model by reference to Appell and Loyle’s (2012) analysis of the apparent economic benefits of justice. Students should read that article to understand the context of what we’re doing. This lab script will just implement one of their basic models and unpack its contents.
#
#   |\      _,,,---,,_
#   /,`.-'`'    -.  ;-;;,_
#  |,4-  ) )-,_..;\ (  `'-'
# '---''(_/--'  `-'\_)
#
# Lab 4: Linear Models
If it’s not installed, install it.
library(tidyverse)
#> ── Attaching core tidyverse packages ──────────────────────── tidyverse 2.0.0 ──
#> ✔ dplyr     1.1.4     ✔ readr     2.1.4
#> ✔ forcats   1.0.0     ✔ stringr   1.5.0
#> ✔ ggplot2   3.5.1     ✔ tibble    3.2.1
#> ✔ lubridate 1.9.2     ✔ tidyr     1.3.0
#> ✔ purrr     1.0.1
#> ── Conflicts ────────────────────────────────────────── tidyverse_conflicts() ──
#> ✖ dplyr::filter() masks stats::filter()
#> ✖ dplyr::lag()    masks stats::lag()
#> ℹ Use the conflicted package (<http://conflicted.r-lib.org/>) to force all conflicts to become errors
library(stevethemes)
library(stevemisc)
#>
#> Attaching package: 'stevemisc'
#>
#> The following object is masked from 'package:lubridate':
#>
#>     dst
#>
#> The following object is masked from 'package:dplyr':
#>
#>     tbl_df
Load the data
This code will work for me and it will assume you’ve downloaded the
.dta file in question and put it somewhere on your hard drive. Do you
see that haven::read_dta() function? Put the location to the
appelloyle_jprdata.dta file there.
To make this simpler, we’re going to use mutate() as a glorified
rename() to create more intuitive variable names and select just what
we want for this simple exercise. However, successful execution of this
command requires you correctly specifying the location of the .dta
file you downloaded from Athena.
haven::read_dta("http://svmiller.com/extdata/appelloyle_jprdata.dta") %>%
  mutate(fdi = v3Mdiff,
         pcj = truthvictim,
         econ_devel = fv8,
         econ_size = fv10,
         econ_growth = fv11,
         kaopen = fv34,
         xr = xratf,
         lf = labor,
         lifeexp = v64mean) %>%
  select(testnewid_lag, ccode, id, fdi:lifeexp) -> Data

# Alternatively, for convenience
Data <- stevedata::EBJ
# Let's look at the contents.

Data
#> # A tibble: 95 × 12
#>    testnewid_lag ccode    id     fdi   pcj econ_devel    econ_size econ_growth
#>            <dbl> <dbl> <dbl>   <dbl> <dbl>      <dbl>        <dbl>       <dbl>
#>  1       2880000    41    71   -9.80     0      1182.   8407079981      -2.13
#>  2       2882880    41    71    6.60     0      1089.   8055393763     -14.9
#>  3       2850000    52   154  510.       0      7743.   9542938026       1.94
#>  4       3080000    70   102 -341.       0      6895. 628418000000      -7.86
#>  5       3083080    70   102 6461.       0      7780. 730752000000       5.23
#>  6       1361360    90    67  431.       1      3062.  31339424077       0.628
#>  7       2200000    92   141   -7        0      2093.   9756946007       2.28
#>  8       2202200    92   141  264.       1      3045.  16729584566       5.89
#>  9       2400000    93   116    2.70     0      1302.   4239808540       1.64
#> 10       2402400    93   116  337.       1      1350.   5588425124      -2.31
#> # ℹ 85 more rows
#> # ℹ 4 more variables: kaopen <dbl>, xr <dbl>, lf <dbl>, lifeexp <dbl>
Incidentally, if you’d like, you can watch me go HAM on this exact data here:
Appel and Loyle (2012)
We’re going to offer a basic replication of Appel and Loyle (2012). Some of you read this for your article summary and are aware of its contents. Briefly: the authors are trying to explain variation in FDI inflows as a function of whether a post-conflict state engaged in post-conflict justice. You may(?) remember some of these things from IRI where you may(?) have read about things like truth commissions and transitional justice. In this application, the authors are measuring whether a post-conflict state engaged in post-conflict justice by whether a post-conflict state set up a truth commission and/or reparation programs. There is a theoretical argument for why we should expect to see a positive relationship that they outline and you should know it. The logic isn’t too hard to follow, though it assumes some comfort with thinking economically, politically, and strategically.
A simple bivariate model
Expressed in regression terms, the authors want to know what is the effect of post-conflict justice (0 or 1) on net FDI inflows over a 10-year post-conflict period. They want an estimate of that effect and whether we can discern a signal from the noise. IF you wanted to do this yourself in R, it’d be something like this.
M1 <- lm(fdi ~ pcj, data = Data)
summary(M1)
#>
#> Call:
#> lm(formula = fdi ~ pcj, data = Data)
#>
#> Residuals:
#>     Min      1Q  Median      3Q     Max
#> -4047.4  -459.1  -418.7  -136.9 22648.3
#>
#> Coefficients:
#>             Estimate Std. Error t value Pr(>|t|)
#> (Intercept)    425.0      323.9   1.312   0.1927
#> pcj           1763.5      744.0   2.370   0.0198 *
#> ---
#> Signif. codes:  0 '***' 0.001 '**' 0.01 '*' 0.05 '.' 0.1 ' ' 1
#>
#> Residual standard error: 2842 on 93 degrees of freedom
#> Multiple R-squared:  0.05696,    Adjusted R-squared:  0.04682
#> F-statistic: 5.618 on 1 and 93 DF,  p-value: 0.01985
When you get this, you’re getting a lot of stuff to look at. I’ll go by order of practical importance.
The star of the show here is the effect of post-conflict justice. See the coefficient is 1763.5 (a large nominal number to be sure). Absent any more information, it suggests that the difference in net FDI inflows over a 10-year period for post-conflict states that engage in PCJ versus those that don’t is a difference of $1,763.5. PCJ states have higher FDI inflows, consistent with the authors’ argument. However, there’s always the lingering chance that a world surrounded by noise resulted in a positive coefficient when the actual “true” effect could be 0. Notice we have a standard error with that estimate, which is 744.0. The process that follows is not too dissimilar to creating z-scores. Take the estimate and divide it over the standard error, and you get that t-value you see of 2.370. Because this is a t-distribution (with 93 degrees of freedom), the process isn’t as simple as inference by the normal distribution. Here, let the fourth column (“Pr(>|t|)”) guide you. That is communicating a probability of observing the (positive) effect we observed if the true differences between groups with and without post-conflict justice is 0. Here’s what this is telling you: if the God’s-honest-truth was that there was no difference in net FDI inflows for these two categories of states, the probability of us observing what we observed, assuming infinity trials, is .0198. That’s so kind of rare that we’re inclined to argue that the effect we observed is closer to what the truth is. It’s not 0; it’s positive, and the estimate of $1763.5 may not be “correct” but it’s closer to the truth than 0.
Oh, btw, if you want to calculate that p-value yourself, here it is.
pt(2.37, df=93, lower.tail = F)*2
#> [1] 0.01985368
^ let R’s default summary() method do it for you.
Because this is a simple bivariate linear model where the IV is incidentally binary, there is a nice interpretation of the intercept. The estimated net FDI inflow for states without PCJ institutions is $425. The estimated net FDI inflow for states with PCJ institutions is $425 + $1763.5. Notice the intercept communicates the estimate of y when everything on the right-hand side of the equation is 0. The fact that it has no “stars” doesn’t tell you it’s not “significant” or whatever because there is no hypothesis attached to the intercept. You’re not evaluating an argument in the intercept, really. However, one interesting wrinkle from this that is germane to the author’s argument is that a simple comparison of groups with PCJ institutions and without PCJ institutions suggests the non-PCJ states may, on average, not be taking in any FDI at all.
I don’t want to say this is necessarily the next “most important” thing,
but it’s probably the next place to go for beginners. Let’s talk
R-square, both of them actually. R-square is a so-called “goodness of
fit” statistic because it tells you how well (‘good’) the model you
estimated “fits” the data. The “multiple” R-square is the overall fit
whereas the adjusted flavor carries a small “penalty” of a kind that
decreases with every parameter added to the model. While multiple
R-square can never be negative (i.e. you’re always explaining at least a
little variation), the adjusted R-square might be negative for models
with lots of noise parameters. In this simple case, notice two
things: 1) The R-square is about .05, suggesting only about 5% of the
variation in net FDI inflows is accounted for by this PCJ indicator. The
adjusted R-square is slightly smaller than the multiple R-square because
you
actually have two parameters here and not one. You have the one
coefficient, but the intercept is a parameter too.
You may have learned this in lecture, but the multiple R-square in the simple bivariate linear model has a nice property. It’s literally Pearson’s r, squared. Observe.
cor(Data$fdi, Data$pcj)^2
#> [1] 0.05696419
broom::glance(M1)[1] %>% pull()
#> [1] 0.05696419
The addition of other parameters breaks this property and the multiple R-square is instead derived from knowing the residuals and the deviance of the model, which is a conversation for the MA students and not you.
A few other things before closing up:
1) R’s default summary output gives you a summary of the residuals, which is kind of wonky. By definition, the mean of the residuals is 0. Ideally, you want the median around there too. Also ideally: a simple linear model with a bivariate IV is kind of borrowing trouble, especially if we haven’t looked carefully at our DV. 2) It’s uncomfortable that a lot of our beginner language says “don’t forget the F-test”, but all the homies hate the F-test. The F-test tests against a null hypothesis that the model you estimate performs just as well as one that is guessing just the mean of the DV. The moment you start to know anything about your data-generating process is the moment you can ignore this statistic. It really is beginner-level stuff from like 100 years ago. 3) The residual standard error is an estimate derived from the model about the variability of the residuals and how they differ from the line. “Higher” values indicate more variability, but also may say something about the data. The model here are nominal dollars, so take that into consideration.
A Replication of Model 1 in Table 1
Let’s replicate Model 1 in Table 1. We started with a simple bivariate model, but we need to add “relevant controls” that could be influencing the relationship between PCJ and FDI. After all, is FDI not an economic matter? It tracks that, for example, capital openness will influence FDI inflows. Post-conflict states are probably poor and without a lot of capital openness. The same can be said for the other indicators in Model 1. How do we “control” for this in the linear model in R? Simple: Add them to the right-hand side of the equation, separated by a + sign. Observe:
M2 <- lm(fdi ~ pcj + econ_devel + econ_size + econ_growth +
           kaopen + xr +  lf+ lifeexp,
         data = Data)

summary(M2)
#>
#> Call:
#> lm(formula = fdi ~ pcj + econ_devel + econ_size + econ_growth +
#>     kaopen + xr + lf + lifeexp, data = Data)
#>
#> Residuals:
#>     Min      1Q  Median      3Q     Max
#> -7445.9  -402.1   123.2   369.1 13484.6
#>
#> Coefficients:
#>               Estimate Std. Error t value Pr(>|t|)
#> (Intercept) -2.012e+03  2.678e+03  -0.751 0.454575
#> pcj          1.533e+03  6.294e+02   2.435 0.016957 *
#> econ_devel  -5.761e-02  1.337e-01  -0.431 0.667617
#> econ_size    1.055e-08  1.674e-09   6.300 1.22e-08 ***
#> econ_growth  7.239e-01  2.130e+01   0.034 0.972963
#> kaopen       1.326e+02  2.080e+02   0.637 0.525581
#> xr          -4.922e+01  1.356e+01  -3.629 0.000481 ***
#> lf           1.472e+01  2.545e+01   0.578 0.564583
#> lifeexp      1.739e+01  3.029e+01   0.574 0.567255
#> ---
#> Signif. codes:  0 '***' 0.001 '**' 0.01 '*' 0.05 '.' 0.1 ' ' 1
#>
#> Residual standard error: 2311 on 86 degrees of freedom
#> Multiple R-squared:  0.4235, Adjusted R-squared:  0.3699
#> F-statistic: 7.897 on 8 and 86 DF,  p-value: 6.561e-08
Let’s talk through a few things of note here:
- The effect of post-conflict justice is basically unchanged. It’s still positive and significant.
- Only economic size and the exchange rate variables return significant effects in their own right.
- R-square is .423 but adjusted R-square is .369. This is an informal observation to make but the discrepancy between the two suggests there are parameters in the model that are basically noise. In particular, the development and growth variables seem to be basically just noise.
- Ignore the F-statistic. Of course you know that your model is performing better than just guessing the mean.
Let’s talk diagnostics
I encourage students to think of the LINE mnemonic for evaluating OLS.
L: the model is linear in its form (without hidden curvilinearity).I: the observations are independent from each other (which is more of something you have to know about your data in advance, which we won’t belabor here).N: the residuals are normally distributedE: the distribution of residuals is equal across the range of the model.
Most of your assessment here can be visual. One of the most useful diagnostics is the fitted-residual plot. For each observation, take the estimated (fitted) values of y from the model and the residuals (estimation errors) for all those observations. Make a scatterplot. By definition, the rise-over-run is flat at 0. The LOESS smoother can tell you if that’s a good fit or not.
We’ll keep it simple, so let’s focus a bit on what’s going to happen
here, using the augment() function in {broom} (you have this).
broom::augment(M2) %>%
  select(.fitted, .resid) %>%
  bind_cols(Data, .) -> Data
Let’s get an idea of what’s happening here before going any further.
Data %>%
  select(fdi, .fitted, .resid) %>%
  mutate(y_is_fitted_plus_resid = .fitted +.resid)
#> # A tibble: 95 × 4
#>        fdi .fitted .resid y_is_fitted_plus_resid
#>      <dbl>   <dbl>  <dbl>                  <dbl>
#>  1   -9.80   -129.   119.                  -9.80
#>  2    6.60   -124.   131.                   6.60
#>  3  510.     -430.   940.                 510.
#>  4 -341.     6451. -6792.                -341.
#>  5 6461.     7563. -1102.                6461.
#>  6  431.     1894. -1463.                 431.
#>  7   -7      -218.   211.                  -7
#>  8  264.     1505. -1241.                 264.
#>  9    2.70   -364.   367.                   2.70
#> 10  337.    -2958.  3295.                 337.
#> # ℹ 85 more rows
Now, let’s get to the heart of the matter.
Data %>%
  ggplot(.,aes(.fitted, .resid)) +
  geom_point(pch = 21) +
  theme_steve(style='generic') +
  geom_hline(yintercept = 0, linetype="dashed", color="red") +
  geom_smooth(method = "loess")
#> `geom_smooth()` using formula = 'y ~ x'

Wooooof, that should not look like that. What you want to see is basically featureless, patternless buckshot. Something like this:
tibble(x = rnorm(95),
       y = 5 + x + rnorm(95)) -> A

M4 <- lm(y ~ x, A)

broom::augment(M4) %>%
  ggplot(.,aes(.fitted, .resid)) +
  geom_point(pch = 21) +
  theme_steve(style='generic') +
  geom_hline(yintercept = 0, linetype="dashed", color="red") +
  geom_smooth(method = "loess")
#> `geom_smooth()` using formula = 'y ~ x'

What you’re looking at is a cry for help.
One limitation of the fitted-residual plot, however, is that it won’t
tell you where exactly the issue might be. That’s why I wrote the
linloess_plot() in {stevemisc}. This plot takes a model object and,
for each right-hand side variable, draws a rise-over-run line of best
fit and the LOESS smoother with respect to either the residuals
(default) or the raw values of the dependent variable. Do note this
tells you nothing about binary IVs, but binary IVs aren’t the problem
here.
linloess_plot(M2, pch=21) +
  theme_steve(style='generic')
#> `geom_smooth()` using formula = 'y ~ x'
#> `geom_smooth()` using formula = 'y ~ x'
#> Warning in simpleLoess(y, x, w, span, degree = degree, parametric = parametric,
#> : at -0.005
#> Warning in simpleLoess(y, x, w, span, degree = degree, parametric = parametric,
#> : radius 2.5e-05
#> Warning in simpleLoess(y, x, w, span, degree = degree, parametric = parametric,
#> : all data on boundary of neighborhood. make span bigger
#> Warning in simpleLoess(y, x, w, span, degree = degree, parametric = parametric,
#> : pseudoinverse used at -0.005
#> Warning in simpleLoess(y, x, w, span, degree = degree, parametric = parametric,
#> : neighborhood radius 0.005
#> Warning in simpleLoess(y, x, w, span, degree = degree, parametric = parametric,
#> : reciprocal condition number 1
#> Warning in simpleLoess(y, x, w, span, degree = degree, parametric = parametric,
#> : There are other near singularities as well. 1.01
#> Warning in simpleLoess(y, x, w, span, degree = degree, parametric = parametric,
#> : zero-width neighborhood. make span bigger
#> Warning: Failed to fit group -1.
#> Caused by error in `predLoess()`:
#> ! NA/NaN/Inf in foreign function call (arg 5)
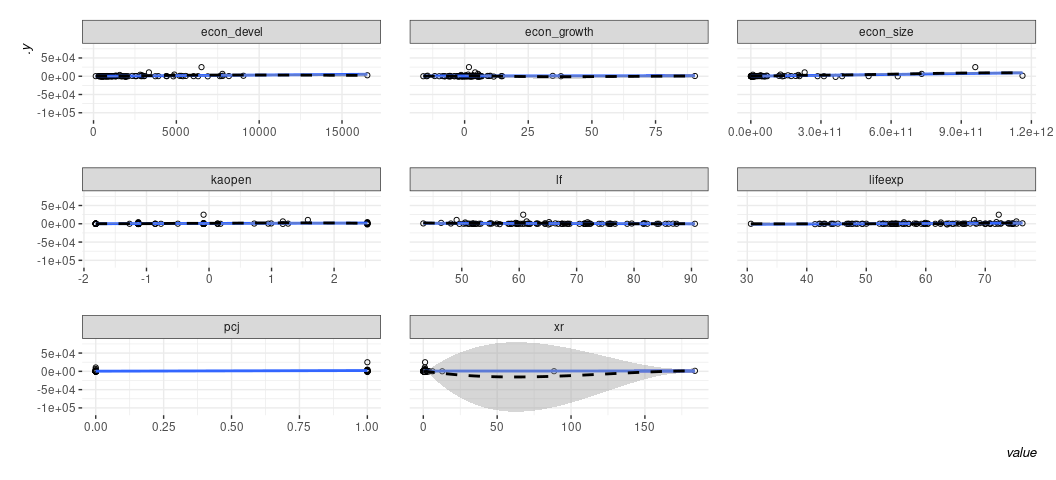
^ A couple of things stand out here to me: 1) the model is so offended by the presence of the exchange rate variable that it’s making anything else impossible to see. Two: that econ_growth variable has some weirdness happening around 0 that implies some kind of non-linear effect.
What does the histogram say?
Data %>%
  select(econ_growth, xr) %>%
  gather(var, val) %>%
  ggplot(.,aes(val)) + geom_histogram(bins=40) +
  facet_wrap(~var, nrow = 2, scales='free') +
  theme_steve(style='generic')

Iiiiiinteresting. You’re free to play around with this, but use your head a bit. It implies there are a few categories of “growth”. Some are negative, which is its own problem. Some are are within “normal” (i.e. about 2%, let’s say). More are way beyond that and on islands to themselves. As for the exchange rate variable? Let’s just say such a distribution is revolting and leave it at that. It implies you have to think long and hard about what those observations are doing in your model.
A comment on “normality”
OLS assumes the errors are normally distributed. This is often conflated with an assumption that the outcome variable is normally distributed. That’s not quite what it is. It does imply that the conditional distribution of the dependent variable is normal but that is not equivalent to assuming the marginal distribution of the dependent variable is normal. At the end of the day, the assumption of normality is more about the errors than the dependent variable even as the assumption about the former does strongly imply an assumption about the latter.
Violating the assumption of a normal distribution of the errors is not as severe as a violation of some of the other assumptions. The normality assumption is not necessary for point estimates to be unbiased. In one prominent textbook on statistical methods, Gelman and Hill (2007, p. 46) say the normality assumption is not important at all because it has no strong implication for the regression line. I think this follows because Gelman and Hill (2007)—later Gelman, Hill, and Vehtari (2020)—are nowhere near as interested in null hypothesis testing as your typical social scientist likely is. No matter, violating the assumption of a normal distribution of errors has some implication for drawing a line that reasonably approximates individual data points (if not the line itself, per se). Thus, you may want to check it, certainly if you have a small data set.
My misgiving with these normality tests is that they all suck, even at
what they’re supposed to do. The “textbook” normality tests involve
extracting the residuals from the model and checking if their
distribution is consistent with data that could be generated by a normal
distribution. The two implementations here are typically base R. One is
the Shapiro-Wilk test. The other is the Kolmogorv-Smirnov test. There
are more—like the Anderson-Darling test—which you can also do and is
communicating the same thing. You can explore a few of these in the
{nortest} package.
shapiro.test(resid(M2))
#>
#>  Shapiro-Wilk normality test
#>
#> data:  resid(M2)
#> W = 0.65383, p-value = 1.219e-13
ks.test(resid(M2), y=pnorm)
#>
#>  One-sample Kolmogorov-Smirnov test
#>
#> data:  resid(M2)
#> D = 0.65263, p-value < 2.2e-16
#> alternative hypothesis: two-sided
When p-values are sufficiently small, these tests are saying “I can determine these weren’t generated by some kind of normal distribution.” My misgiving with these particular tests are multiple. One, you can dupe them pretty easily with a related distribution that looks like it, but is not it (e.g. Student’s t). Two, they are deceptively just a test of sample size. The more observations you have, the more sensitive the test is to any observation in the distribution that looks anomalous. Three, textbooks typically say to use the K-S test if you have a large enough sample size, but, from my experience, that’s the test that’s most easily duped.
Here’s what I recommend instead, knowing that the normality assumption of errors is one of the least important assumptions: visualize this instead. For one, the “textbook” visual diagnostic is the Q-Q plot. This is actually a default plot in base R for linear models if you know where to look.
plot(M2, which=2)
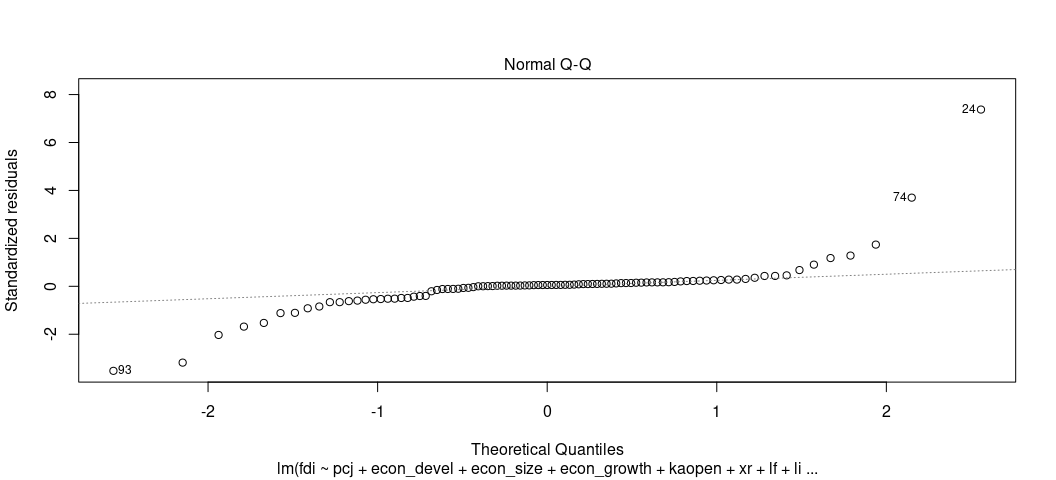
The Q-Q plots the theoretical quantiles of the residuals against the standardized residuals. Ideally, they all fall on a nice line. Here, they don’t, suggesting a problem. The negative residuals are way more negative than they should be and the positive residuals are way more positive than they should be.
I think a better way of doing this is another visual exercise. Take your residuals and create a density plot of them. Over that, create a normal distribution with a mean of 0 and a standard deviation that matches that description. In cases where the normality tests still flunk you, the normality assumption may still be reasonably approximated. Let’s see what they look like here.
Data %>%
  ggplot(.,aes(.resid)) +
  stat_function(fun = dnorm, color="blue",
                args = list(mean = 0,
                            sd = sd(Data$.resid, na.rm=T)),
                linetype="dashed", size=1.1) +
  geom_density(size = 1.1) +
  theme_steve(style='generic')
#> Warning: Using `size` aesthetic for lines was deprecated in ggplot2 3.4.0.
#> ℹ Please use `linewidth` instead.
#> This warning is displayed once every 8 hours.
#> Call `lifecycle::last_lifecycle_warnings()` to see where this warning was
#> generated.

^ wooof. Kill this with fire.
Your solution to this particular “problem” will depend on what exactly you’re doing in the first place. The instances in which these plots look really problematic will be situations like these. Your model may have relatively few covariates and the covariates you do include are dummy variables. If you have so few observations in the model (i.e. I can count the number of observations in the model on one or three hands), any distribution of residuals will look crazy. That’s somewhat of the case here. We have a few observations, but enough (on paper) granularity in the variables that this should not be happening in an ideal world. It’s more likely the case that you have a dependent variable that you are pretending has a nice and pretty distribution. That’s almost assuredly the case here.
Data %>%
  ggplot(.,aes(fdi)) + geom_density() +
  theme_steve(style='generic')
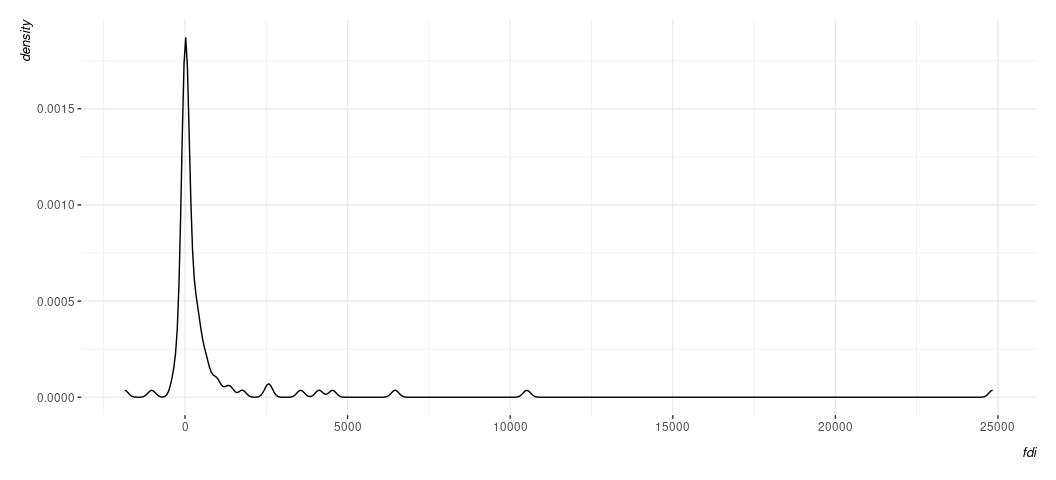
^ it’s one thing for there to be this kind of tail. It’s another for it to be driven by so few observations. It’s possible you may want to condense the scale here, even if you have to be mindful about the negative values of a log transformation.